
PHOEBE R&D Blog
The PHOEBE Project R&D blog serves as a platform for sharing insights, updates, and breakthroughs related to the PHOEBE Project. It focuses on innovative research and development in road safety and features articles written by team members, showcasing ongoing studies, methodologies, and findings.
Click on the following links to jump to the latest blogpost!
News Items
15 December: Advancing Urban Mobility Decision-Making through Integrated Systems and Tools
3 September 2025: Smartphone use during driving – new data, investigations and early-stage insights
25 August 2025: Behind the models & simulation methodology (D3.2): Part 2: Advancing human behaviour estimation in microsimulation
29 July 2025: Behind the models & simulation methodology (D3.2): Part 1: Integrating Risk into Mode Shift Analysis: PHOEBE’s Innovative Approach
14. October 2024 Detection of Traffic Violations in Urban Environments Using Video Analysis and Machine Learning: A Case Study in Athens:
27. September 2024: Analysing speed profiles for fatality and serious injury (FSI) score calculation in the West Midlands
15 December: Advancing Urban Mobility Decision-Making through Integrated Systems and Tools
At the PHOEBE Consortium Meeting in Bled, Slovenia, on 3 December 2025, the NTUA team presented the main developments of Work Package 5: Systems Integration and Transferability.
The session outlined how PHOEBE combines behavioural data, simulation tools and safety assessment methods to improve urban mobility decision-making. Using results from the Athens pilot city, the presentation highlighted the value of linking real-world behavioural observations with advanced modelling to better understand interactions between pedestrians, cyclists and other road users. The need for tools that compare existing conditions with potential interventions was also emphasised, setting the context for the WP5 framework.
The Community of Practice session explored the technical framework developed in WP5 in greater depth, with particular focus on Impact Modification Factors (IMFs). Inspired by established road safety approaches, IMFs quantify how interventions such as street reallocation, lower speed limits or improved cycling infrastructure influence safety, mobility and environmental performance. The WP5 team and the Athens Use Case leader demonstrated how IMFs are calculated using behavioural modelling, traffic microsimulation and iRAP-based safety assessments.
The session also showcased a multi-scenario database bringing together simulation results, emissions data and safety ratings from all pilot cities. In addition, the NTUA team presented the first version of the PHOEBE Decision Support Tool, which allows users to compare baseline and intervention scenarios through clear visualisations of TTC, emissions and other indicators. Overall, the framework offers cities a practical and transferable tool to support evidence-based planning and policy development.
3 Sept 2025: Advancing Urban Mobility Decision-Making through Integrated Systems and Tools
If you have further questions about the content or would like to learn more about this R&D aspect, please contact: The Floow
Smartphone use while driving has long been recognised as a major contributor to road risk. Numerous academic studies and reviews have attempted to quantify this risk and understand mobile phone use behind the wheel. However, these studies report highly variable results. Estimates range from 13% of all police-reported motor vehicle traffic crashes (NHTSA, 2023) to 68.3% (Dingus et al. 2016). Despite the widespread acknowledgement of this risk, around 48% of EU drivers admit to using smartphones to make calls when driving. Even more concerning, approximately 29% of EU drivers report using smartphones in handheld mode while driving, a riskier behaviour and a criminal offence in most EU countries (ERSO, 2023).
Current approaches to measuring smartphone use during driving have clear limitations. In-vehicle monitoring is typically prohibitively expensive and only captures small, unrepresentative samples of drivers in limited studies. Alternatively, fixed-location monitoring cannot provide the geographic coverage needed to fully understand where and how risk occurs. As a result, important questions remain:
• Do drivers adapt their behaviours when using smartphones, partially mitigating risk?
• Is the use of smartphones at certain locations or times associated with higher levels of risk?
• Could location-specific interventions be effective, and if so, where should they be targeted?
As part of its work to build next-generation risk frameworks, PHOEBE has undertaken investigations into this challenge. Our research has focused on generating new data and insights into smartphone-related risks using large-scale, anonymised telematics and phone-use data collected across wide geographies and timeframes.
To explore driving risk associated with smartphone use, we adopted a statistical approach to correlate and quantify phone-use behaviour across locations and times, including the context of driving environment. This required the development of new methods for handling and analysing heterogeneous data, ultimately providing fresh insights into the spatial and temporal patterns of risk.
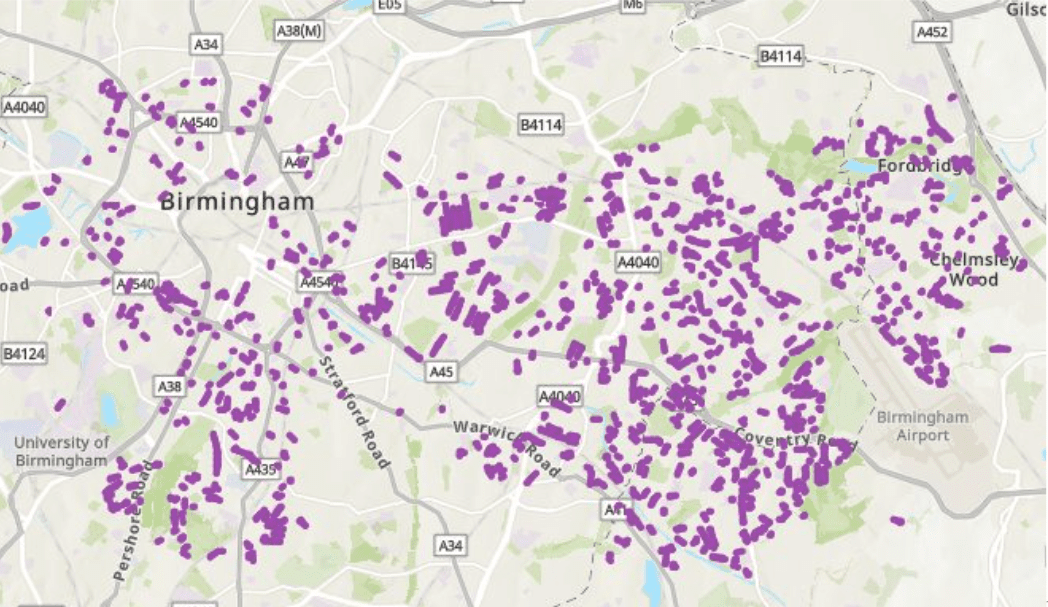
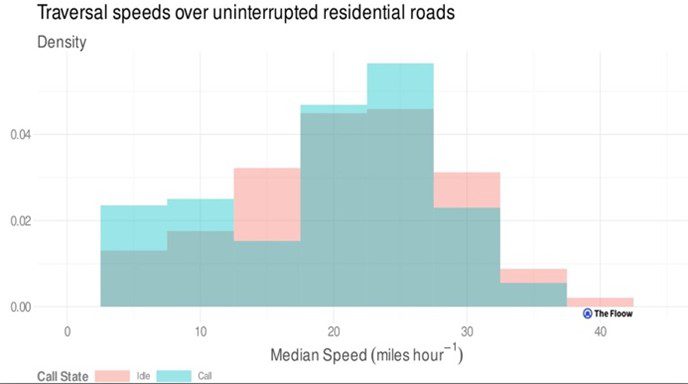
Our work has demonstrated proof of value (TRL 3) for new technical methods that directly capture smartphone usage during driving, including the context of when and where it occurs. Early findings strongly suggest that driving behaviour is differentiated during smartphone use, with noticeable variations across road types, times, and locations. Crucially, the results show that smartphone use is not evenly distributed: rather, it varies depending on geography, context, time of day, and day of the week.
An example of this analysis is shown below (Figures 1 and 2). These figures illustrate anonymised driving behaviours on uninterrupted sections of residential roads (i.e. stretches without intersections) in the West Midlands use-case area.
3 Sept 2025: Smartphone use during driving - new data, investigations and early-stage insights
We have developed the capability to measure the frequency and duration of calls across different conditions and regions, enabling the potential to model risk potential at a fine-grained level across large geographic areas and different timeframes.
What’s next?
approaches in localised and contextual risk understanding in relation to smartphone use while driving. The results indicate a significant potential value in scaling up the analysis across wider geographies, which could lead to powerful new policy insights and practical tools for road safety.
Building these early-stage capabilities, further work beyond the project is planned to extend the impact of this research. These future efforts will aim to develop new data-driven risk insights and products, ultimately contributing to safer roads across Europe.
References
ERSO, 2023 | |
Dingus et al. 2016 | |
NHTSA, 2023 |
25 August 2025: Behind the models & simulation methodology (D3.2): Part 2: Advancing Human Behaviour Estimation in Microsimulation
This is the second blog entry that summarises parts of the sensitive deliverable D3.2 “Finalised models/simulation environments methodology factsheets and user support materials”.
Humans are wonderfully unpredictable. One moment we’re making rational decisions, and the next we’re driven by emotion, instinct, or a sudden change in context. This unpredictability can pose challenges, especially when designing systems, policies, or planning a team project. But here’s the good news: while we may never fully predict every human action, behavioural models give us a powerful lens to understand patterns in how people tend to respond in certain traffic situations. These models, grounded in psychological and sociological theory and informed by data, help anticipate how individuals respond to stress, incentives, group dynamics, and other behavioural triggers..
In the PHOEBE project, we are not only developing a human behavioural model but also integrating it into traffic simulation to allow a better prediction of the safety impact of urban changes. This work, developed in collaboration between the Technical University of Delft and Aimsun, enhances the realism and predictive power of simulations by embedding nuanced behavioural responses into traffic scenarios.
The behavioural models are grounded in Stated Preference (SP) surveys conducted across the three PHOEBE use cases (Athens, Valencia and the West Midlands). These surveys captured demographic data, past behaviours, personality traits, and responses to hypothetical traffic scenarios. The resulting models—primarily Cumulative Link Mixed Models (CLMMs)— estimate ordinal propensities to engage in non-compliant behaviours—such as car drivers speeding, pedestrian crossing outside designated areas, and micromobility users red-light violations—as functions of traffic conditions, infrastructure attributes, socio-demographics, and latent psychological traits. The models were developed to tailor to the use case demand and subsequently integrated into the microscopic simulator of the Aimsun Next Software via an API
Key Enhancements
- Speeding Behaviour Simulation
A new Python API was developed to simulate speeding behaviour based on both traffic conditions and human factors. The model dynamically adjusts vehicle speeds using parameters such as traffic density, presence of speed cameras, and driver characteristics like age, gender, and past behaviour. This allows for a more accurate representation of real-world speeding tendencies across different urban contexts. - Red-Light Violations by Micromobility Users
For the Valencia use case, the PHOEBE team implemented a novel API to simulate red-light violations by cyclists and e-scooter users. The system considers intersection geometry, traffic flow, and user-specific behavioural traits (e.g. age, social value orientation (personality trait), past traffic behaviour) to determine the likelihood of a violation at each simulation step. - Pedestrian Red-Light Violations and Crossing outside designated areas
In Athens, new functionalities were added to model pedestrian red-light violations and crossings outside designated areas. These behaviours are triggered based on contextual factors such as traffic signal status, crossing width, and pedestrian urgency. The models also account for demographic and psychological attributes, enabling a more granular understanding of pedestrian risk.
Use Case Insights
- Athens: Focused on pedestrian behaviours, including red-light violations and crossing outside designated areas..
- Valencia: Emphasised micromobility user behaviour, particularly red-light violations.
West Midlands: Concentrated on speeding behaviour among car drivers.
29 July 2025: Behind the models & simulation methodology (D3.2): Part 1: Integrating Risk into Mode Shift Analysis: PHOEBE’s Innovative Approach
This is the first blog entry that summarises parts of the sensitive deliverable D3.2 “Finalised models/simulation environments methodology factsheets and user support materials”, which presents the results of the framework preparation for the pilot, the technical evaluation of the model enhancements, and the final refinements conducted in the individual models.
Measured risk and perceived road safety risk offer two distinct yet complementary lenses for understanding transport safety. Measured risk is grounded in objective data—such as crash statistics, exposure rates, and infrastructure conditions—and is often quantified using tools like the iRAP Star Rating Models to assess the actual likelihood and severity of harm. In contrast, perceived risk reflects how safe individuals feel in a given setting, shaped by personal experiences, environmental cues, and social context. While perceived risk data is typically gathered through crowdsourced mapping apps, structured surveys, participatory workshops, and increasingly through behavioural data from mobile sensors, it remains difficult to collect consistently across all urban interventions. To address this gap, the PHOEBE framework introduces an innovative method: using relative measured risk between transport modes as a proxy within mode shift calculations.
Relative Risk Calculations
PHOEBE determines relative risk using Star Rating results for various road users—car occupants, motorcyclists, pedestrians, and bicyclists—with adjustments to include public transport. These risks are benchmarked against public transport to highlight, for example, how much riskier bicycling may be than riding a tram in specific urban scenarios. This relative risk is then embedded into PHOEBE’s mode shift simulations, allowing cities to evaluate the safety impact of interventions before implementation.
Mode Shift Modelling
The framework’s mode shift models incorporate factors such as monetary costs, travel times, and relative risk associated with the available modes in the study region. Apart from these factors, these models also assimilate socio-demographic and behavioural factors. Through these models, secondary values, e.g., the value of time (VoT), travel cost sensitivity, social value orientation, and effects of risk associated with the modes and how they affect different user groups (by age, gender, or travel habits) can be estimated. In Valencia, for instance, a higher post-COVID VoT revealed a stronger preference for walking in the city centre, demonstrating how behavioural shifts can be captured and linked to safety outcomes.
From Simulation to Policy
By connecting mode shift predictions with safety metrics, PHOEBE empowers cities to make evidence-based decisions that prioritise both sustainability and safety. Whether reallocating road space or introducing new mobility services, the framework ensures that interventions not only reduce measured risk but also encourage citizens to adopt safer, more sustainable transport modes.
14.10.2024: Detection of Traffic Violations in Urban Environments Using Video Analysis and Machine Learning: A Case Study in Athens
If you have further questions about the content or would like to learn more about this R&D aspect, please contact: shanna.lucchesi@irap.org
Summary of the experiment
Traffic violations such as speeding, illegal crossings, and jaywalking pose significant risks in urban environments. A comprehensive approach to detecting and analysing these violations using video recordings and machine learning techniques has been implemented in the context of the PHOEBE project. Focusing on eight critical locations in Athens, Greece, 64 hours of video data during peak and off-peak hours have been collected and processed, which was done by utilising YOLOv8 object detection algorithm and ResNet50 features.
ResNet-50 is a convolutional neural network (CNN) that can dissect a picture, identify objects and scenes within it, and categorize them accordingly. The solution is part of a wider series of models designed to address the challenges associated with training deep neural networks. For the PHOEBE tests, it was used to assess the video footage to track and clarify pedestrians and vehicles accurately.
The implementation of Kalman filters and Savitzky-Golay filters enhanced the accuracy of object trajectories and reduced noise in the data. Whereas the Kalman filter provided predictions of object positions in subsequent frames, the Savitzky-Golay Filters were applied to reduce noise in the data by smoothing the object trajectories without distorting the signal’s tendency.
The results demonstrate the effectiveness of the proposed method in identifying traffic violations and offer insights for improving urban traffic management.
Introduction
Urban areas worldwide grapple with traffic violations that compromise road safety and efficiency. In cities like Athens, issues such as speeding, illegal crossings, and jaywalking can lead to accidents and congestion. Traditional methods of monitoring traffic violations are often labour-intensive and limited in scope (Forero et al., 2019). Advances in computer vision and machine learning offer new opportunities for automated, scalable detection of traffic infractions (Shivanna et al., 2024).
This research aims to develop an automated system for detecting traffic violations using video data and advanced machine learning algorithms. By focusing on specific high-risk locations in Athens, we seek to provide actionable insights that can inform policy decisions and improve road safety.
Site Selection and Data Collection
Eight locations have been identified as critical in Athens known for frequent traffic violations, including the intersection of Vasilissis Sofias Avenue and Panepistimiou Street, an area adjacent to the Athens Great Walk. The selection was based on historical data and expert knowledge of local traffic patterns, as well as the study areas covered by the PHOEBE project. Video recordings were conducted over two weeks at the end of June. For each location, we captured:
- One hour during peak traffic time.
- One hour during off-peak time.
- On two working days: Tuesday and Thursday.
This resulted in approximately 8 hours of video per location, totaling 64 hours of data. Due to constraints in obtaining aerial permissions, cameras were installed at ground level, which introduced certain challenges, including frequent inquiries from local police, as well as people moving in front of the cameras and blocking the video view, among other obstructions.

Preprocessing and Object Detection
The video data underwent preprocessing to enhance quality and prepare for analysis. We employed the YOLOv8 (You Only Look Once version 8) object detection algorithm for its real-time detection capabilities. To improve detection accuracy, especially in crowded scenes, we integrated additional features:
- ResNet50: A deep residual network used for feature extraction, aiding in distinguishing between different object classes.
- ReID (Re-Identification) Features: Enabled consistent tracking of objects across frames by assigning unique IDs.
Tracking and Noise Reduction
To maintain accurate tracking of pedestrians and vehicles, we implemented the following:
- Kalman Filters: These are commonly used in object tracking algorithms because they predict the future position of objects based on their previous motion. This is particularly helpful in situations where the objects become temporarily obscured or occluded (e.g., when a vehicle moves behind a bus). In this way, Kalman filters allow us to continue tracking objects smoothly across frames even when visual data is partially missing.

- Savitzky-Golay Filters:
These filters are used to reduce the “noise” or random variations in the object trajectories without distorting the overall motion patterns. Noise can result from various factors, such as camera shake or minor inconsistencies in the video data. The Savitzky-Golay filter smooths the data, ensuring that we accurately follow the true path of vehicles and pedestrians while filtering out any erratic movements that may not reflect reality.

Tracking and Noise Reduction
To maintain accurate tracking of pedestrians and vehicles, we implemented the following:
- Kalman Filters: These are commonly used in object tracking algorithms because they predict the future position of objects based on their previous motion. This is particularly helpful in situations where the objects become temporarily obscured or occluded (e.g., when a vehicle moves behind a bus). In this way, Kalman filters allow us to continue tracking objects smoothly across frames even when visual data is partially missing.
- Savitzky-Golay Filters:
These filters are used to reduce the “noise” or random variations in the object trajectories without distorting the overall motion patterns. Noise can result from various factors, such as camera shake or minor inconsistencies in the video data. The Savitzky-Golay filter smooths the data, ensuring that we accurately follow the true path of vehicles and pedestrians while filtering out any erratic movements that may not reflect reality.
Coordinate Transformation and Analysis
Using homography transformations, we converted the camera perspective to a top-down 2D static overhead view. This facilitated the calculation of accurate trajectories and speeds. We defined specific regions of interest (ROIs) corresponding to crosswalks and traffic signals to assess legal and illegal crossings. The ROIs were defined based 4 points from the map for the crosswalks and regarding the traffic signals a color id was also included in order to integrate the red and green traffic light and in this way address the illegal or illegal crossing.
Speed and Time-to-Collision Calculations
We calculated the speed of each tracked object using frame-to-frame displacement combined with time stamps. The time-to-collision (TTC) metric was computed based on the relative positions and velocities of objects approaching potential collision points. While effective, this calculation faced challenges due to varying object sizes and the reliance on centroid positions.
This algorithm successfully detected and classified pedestrians, and vehicles in the video data. Key findings include:
- Illegal Crossing Detection: Identified numerous instances of pedestrians crossing outside designated areas or against traffic signals.
- Speed Analysis: Recorded vehicle speeds, highlighting instances of speeding in the monitored areas.
- Time-to-Collision Alerts: Calculated TTC values, identifying potential collision risks between pedestrians and vehicles.
The integration of Kalman and Savitzky-Golay filters significantly improved the accuracy of object tracking and speed calculations. Additionally, the overhead view transformation allowed for precise mapping of trajectories within the traffic environment.
The study demonstrates the potential of combining advanced object detection algorithms with traditional filtering techniques for traffic violation detection. Despite the challenges posed by ground-level camera placement and the dynamic nature of urban traffic, the system performed robustly.
However, certain limitations were noted:
- Time-to-Collision Accuracy: The TTC calculations were less accurate for larger vehicles due to centroid-based measurements not accounting for object dimensions.
- Camera Perspective: Ground-level cameras introduced occlusions and perspective distortions that could affect detection accuracy.
Future work should consider the following:
- Calibration Enhancements: Implementing calibration techniques to adjust for camera perspective and object size variations.
- Permission for Elevated Cameras: Securing permissions for elevated camera placement to improve the field of view and reduce occlusions.
- Real-Time Processing: Optimizing the algorithms for real-time analysis to enable live monitoring and immediate interventions.
Conclusion
This research presents a viable approach to automated traffic violation detection using video analysis and machine learning. The successful application in Athens underscores the method’s adaptability to complex urban environments. By providing detailed insights into traffic behaviors, the system can serve as a valuable tool for city planners and law enforcement agencies aiming to enhance road safety and efficiency.
Forero A. and F. Calderon, “Vehicle and pedestrian video-tracking with classification based on deep convolutional neural networks,” 2019 XXII Symposium on Image, Signal Processing and Artificial Vision (STSIVA), Bucaramanga, Colombia, 2019, pp. 1-5, doi: 10.1109/STSIVA.2019.8730234.
Shivanna V Malligere , Guo J-I. Object Detection, Recognition, and Tracking Algorithms for ADASs—A Study on Recent Trends. Sensors. 2024; 24(1):249.
27.09.2024: Analysing Speed Profiles for Fatality and Serious Injury (FSI) Score Calculation in the West Midlands
If you have further questions about the content or would like to learn more about this R&D aspect, please contact: shanna.lucchesi@irap.org
Introduction
Speed is a critical factor in road safety, directly influencing the likelihood and severity of traffic accidents. Traditional approaches to calculating the Fatality and Serious Injury (FSI) score often rely on average speed data, which may not adequately capture the complexities of speed distribution in different traffic environments. This research aims to explore the nuances of speed profiles considering as the use case the West Midlands regions and their implications for calculating the FSI score, with a focus on the B4114 corridor.
Research question: How can speed profiles be used to improve the accuracy of FSI estimations, and what challenges arise when applying these metrics in urban areas with low speed limits?
Methodology
The research focuses on the B4114 corridor in the West Midlands. Speed data was collected using the Floow telematics system, which provides detailed speed profiles at various times of the day. The key metrics analysed were the 50th and 85th percentile speeds, during different time periods: morning peak, afternoon peak, midday, daily average, and nighttime
Results & Findings

The analysis of the B4114 corridor revealed several key findings:
- Low Speeds in Urban Areas: The West Midlands region, particularly in dense urban areas with high pedestrian activity, exhibited generally low speeds. Even the 85th percentile speeds did not exceed the posted speed limit of 20 mph, indicating a compliance with speed regulations in these areas.
- Challenges in Defining Speeding: Given the low speed limits and the narrow range of observed speeds, traditional definitions of speeding (e.g., exceeding the speed limit) may not fully capture the risk posed by speed variations in these environments.
- Need for Alternative Metrics: The study highlighted the potential limitations of using percentile speeds alone to calculate the FSI score. In environments where speed limits are low, and speeds are uniformly distributed, the difference between maximum and mean speeds, or other statistical measures, may provide a better indication of vehicles that pose a higher risk.

Discussion & Conclusions
The research underscores the complexity of using speed profiles to calculate the FSI score in urban environments with low speed limits. While percentile speeds are a useful metric, they may not adequately capture the risk associated with speed variability, particularly in areas where speeds are uniformly low. The findings suggest that alternative metrics, such as speed variability or the difference between maximum and mean speeds, should be explored to enhance the accuracy of FSI calculations.
Further research is needed to refine these metrics and test their applicability in different traffic environments. Additionally, the study highlights the importance of considering the specific characteristics of each corridor when applying these metrics, as a one-size-fits-all approach may not be appropriate in areas with diverse traffic patterns.